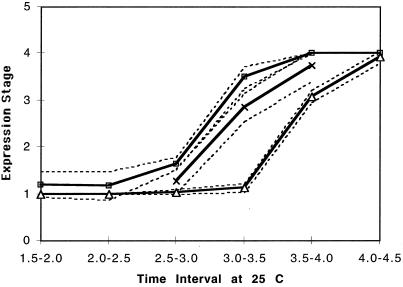
Figure 2.
The expression stage (averaged) of hairy, plotted against the period (hr) since egg deposition. (See Fig. 1 and the text for definition of the stages. Average stages for three species are plotted. ×, D. melanogaster; □, D. simulans; and ▵, D. pseudoobscura. Broken lines indicate 95% confidence interval.

