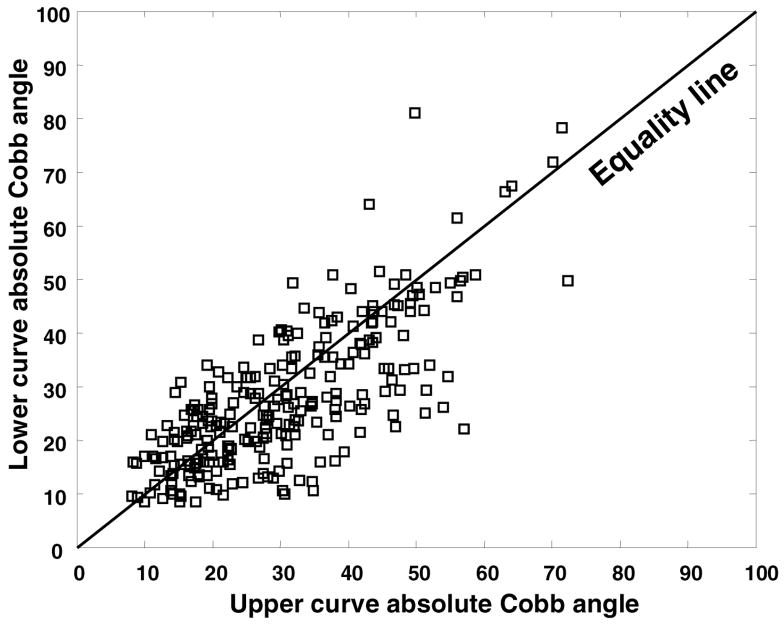
Figure 1.
Scatter plot of the lower versus the upper Cobb angles (absolute values). In the King et al. classification, the relative magnitudes of the Cobb angles can be used to distinguish between Type 1 and Type 2 (King 1 requires lower curve Cobb angle > thoracic - i.e. above the equality line in the scatterplot.)

