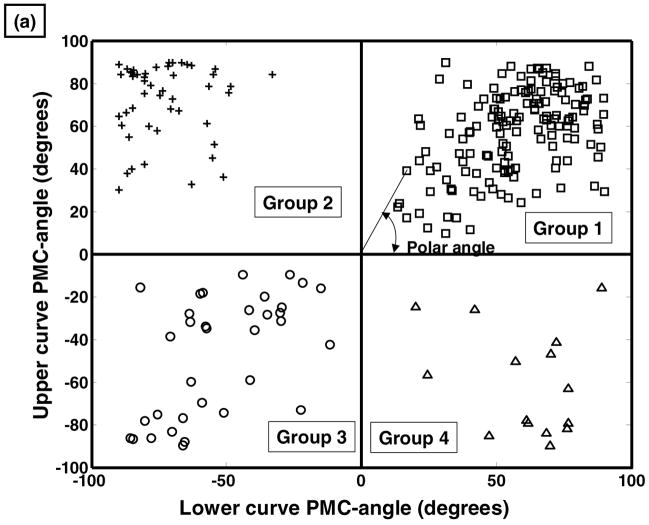
Figure 4.
(a) Scatter plot of the angle of plane of maximum curvature of the upper curve, versus the angle of plane of maximum curvature lower curve. The cluster analysis identified distinct groups in each of the four quadrants of this graph. The location of any observation on this graph can be identified by the ‘polar angle’. (b) histogram of the polar angles, demonstrating distinct differences between the four groups.


