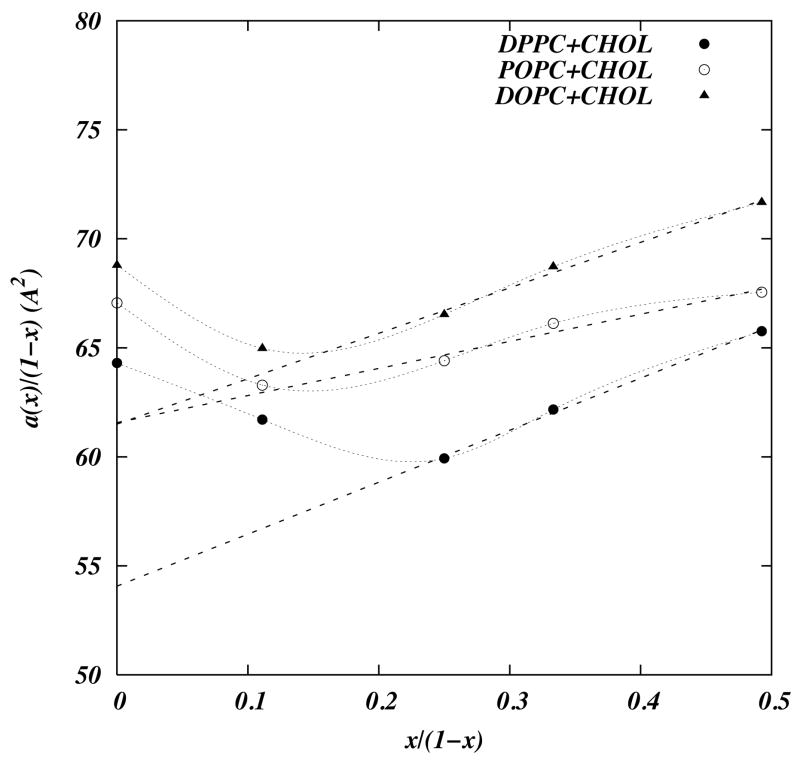
Figure 2.
Plot of the a(x)/(1 − x) of the simulated systems versus concentrations of cholesterol(solid line). Light dashed lines represent linear fits to data for non-zero cholesterol. The slope of the fitted lines correspond to the partial molecular areas of the cholesterol and the y–intercept gives the partial molecular area of DPPC, POPC, and DOPC. Reprinted from ref [55] with permission.

