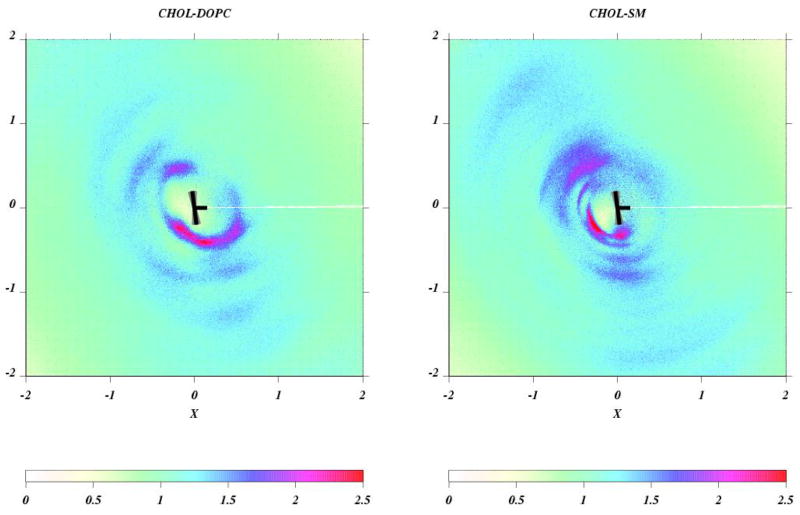
Figure 4.
(left) Density plot of g(r,ϕ) on the XY plane of the cholesterol body coordinate system at 200 ns. A top view of the cholesterol molecule reference frame is schematically shown as black T. The radial distribution function was calculated between O atoms of cholesterol and the backbone CH1 moiety of SM (and also DOPC). Left: DOPC-cholesterol; right: SM-cholesterol. Reprinted from ref [59] with permission.

