
Figure 5.
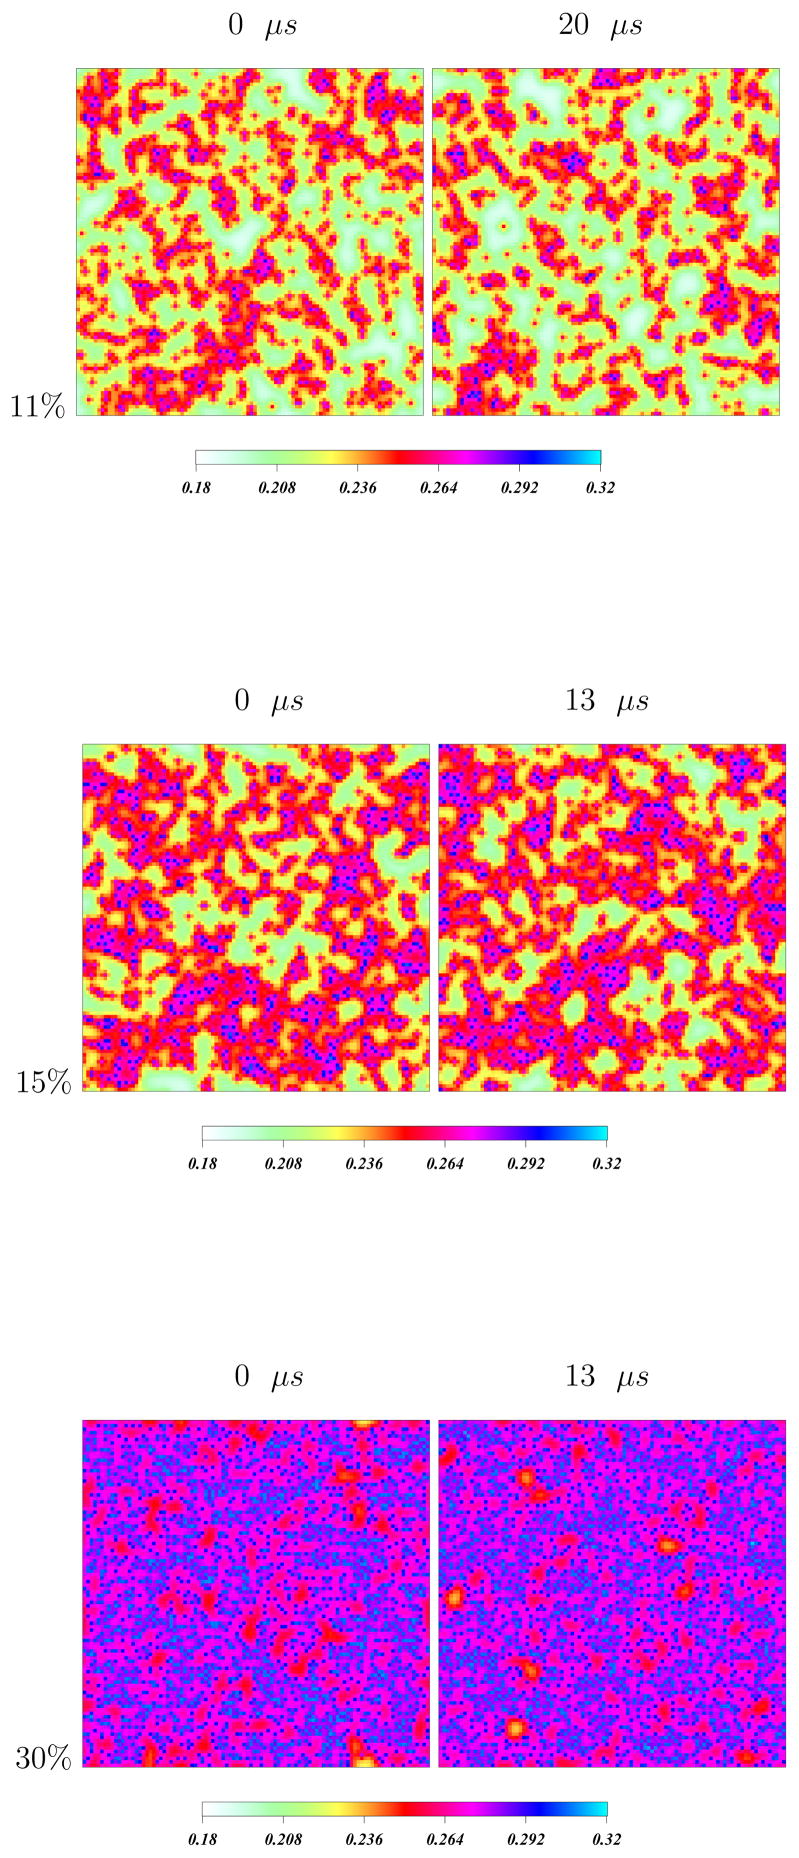
Order parameter density plots of the local DPPC chain order parameter distribution for three different cholesterol concentrations. Times are t = 0(left), and t = 20μs(right). The color scale indicates magnitude of local order parameters on the lattice, with darker colors indicative of greater order. At concentrations between 12–20 % there are regions of high order (blue-red) that are separated by regions of relatively lower order (pale green). Reprinted from ref [57] with permission.