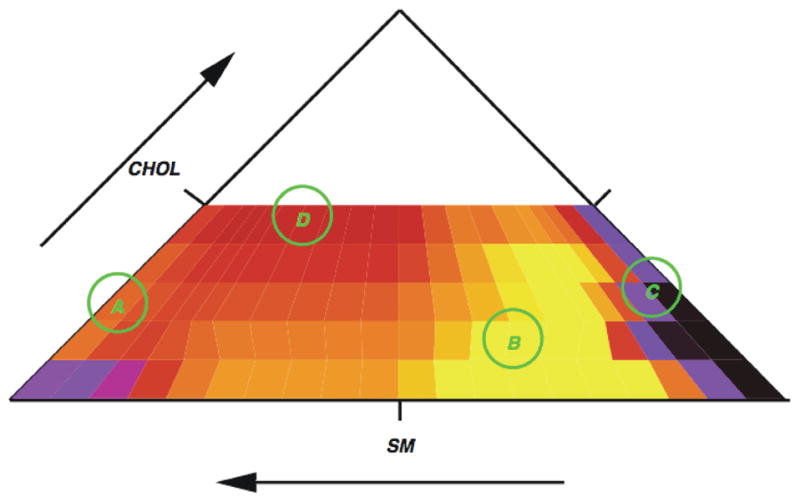
Figure 9.

Preliminary partial ternary phase diagram for DOPC/SM/cholesterol based on heat capacity. The color represents heat capacity with red being the largest. On this diagram there are only four data points (circled) at this time so the plot is meant as a preliminary example only. The data are all for a temperature of 303K.
