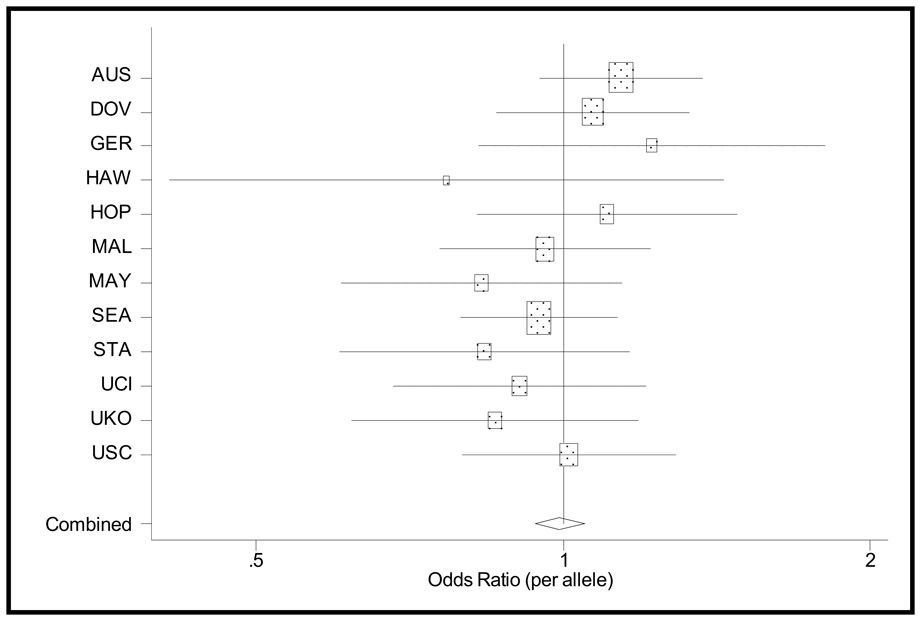
Figure 1.
Estimated age-adjusted odds ratios (boxes) and 95% confidence intervals (lines) from unconditional logistic regression models, for all cases and controls for each of the twelve OCAC replication studies. The combined estimate is from a fixed effects model. The size of each box is proportionate to the study’s size.

