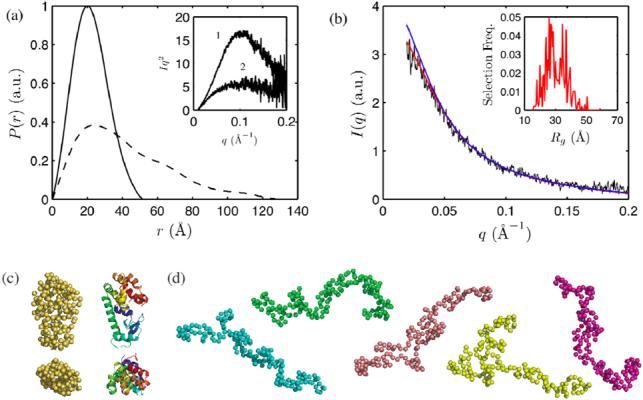
Figure 5.

(a) Pair distance distribution functions of native (28 MPa, solid line) and denatured (300 MPa, dotted line) L99A T4 lysozyme at pH 3.0 obtained with GNOM (28). Inset: Kratky representation of the 28 MPa (1) and 300 MPa data (2). (b) The scattering profile of L99A at 300 MPa (black) was examined with the Ensemble Optimization Method (30). An ensemble of unfolded conformers with residual structure (red scattering profile) better described the experimental data compared to an ensemble of random coil conformers (blue scattering profile). The distribution of Rg in the first ensemble is shown in the inset. (c) Side and top views of the crystal structure of L99A (right) and a representative low-resolution structure at 28 MPa obtained with GASBOR (29) (left) show good agreement. (d) GASBOR models that fit well to 300 MPa data were extended.
