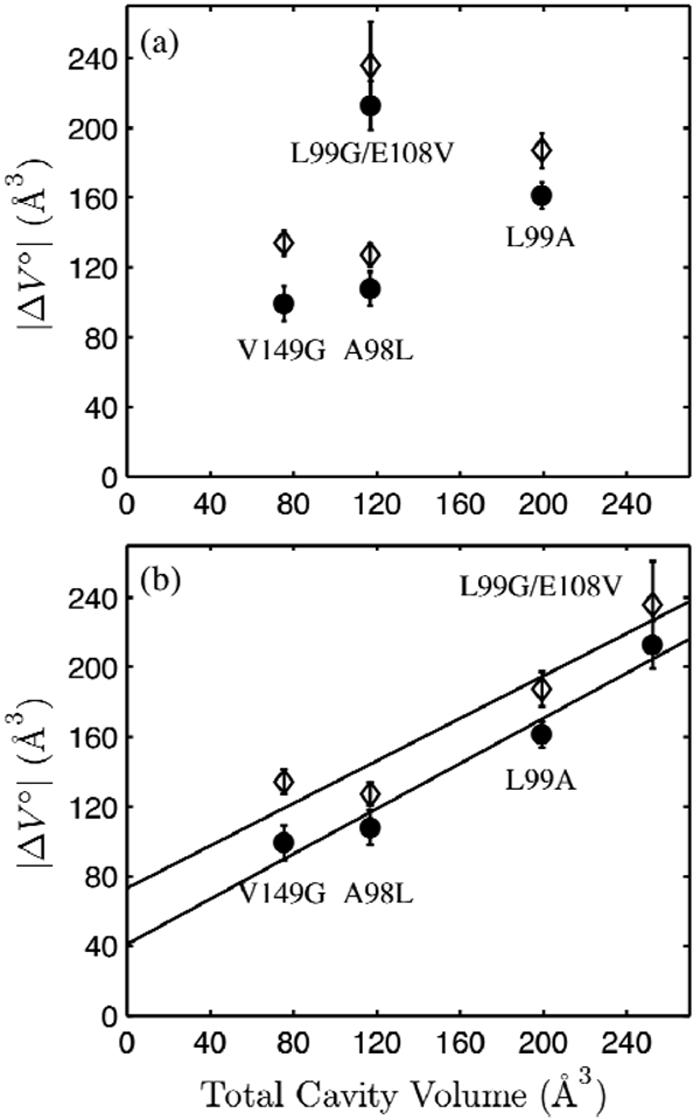
Figure 8.

The volume changes of denaturation (see Table 1) of L99G/E108V, L99A, V149G, and A98L T4 lysozyme in pH 3.0 buffer, 16 °C at 20 mM NaCl (open diamond) and 100 mM NaCl (closed circle) compared to the total cavity volumes calculated from crystal structures using two methods. (a) No correlation is apparent when full occupancy of all crystallographically determined internal solvent-biding sites was assumed in the calculation of cavity volumes. (b) The large cavity of L99G/E108V was assumed to be empty, while full occupancy was assumed for all other internal solvent molecules. The volume changes of denaturation correlate with the total cavity volumes.
