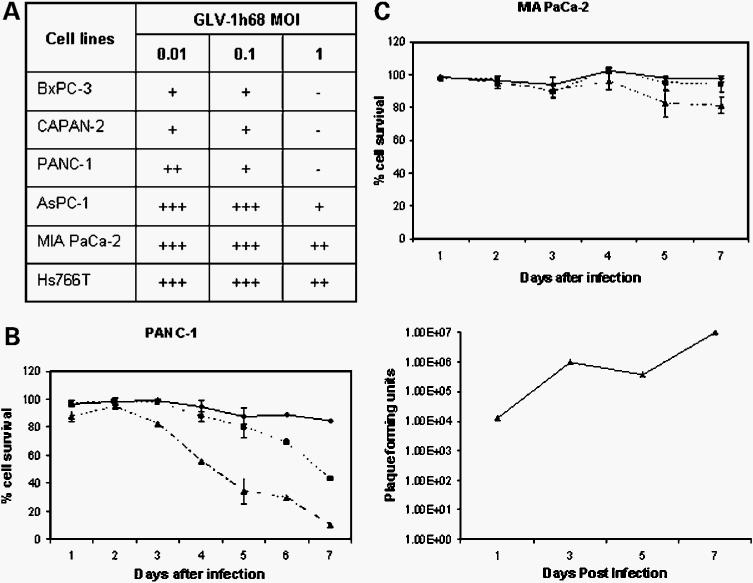
Figure 2.
Tumor cell survival and viral titer analysis in pancreatic tumor cell cultures after GLV-1h68 infection at different MOI. A, summary of percentage of cell survival at different MOI 5 d postinfection. +++, most cells survived; −, most cells were dead. B, percentage of cell survival (left, ◆, 0.01 MOI; ■, 0.1 MOI; ▲, 1 MOI) and profile of viral proliferation in PANC-1 cells (right, 0.01 MOI) over the course of 1 wk postinfection. C, percentage of survival of MIA PaCa-2 cells over the course of 1 wk postinfection. ◆, 0.01 MOI; ■, 0.1 MOI; ▲, 1 MOI.

