
Figure 3.
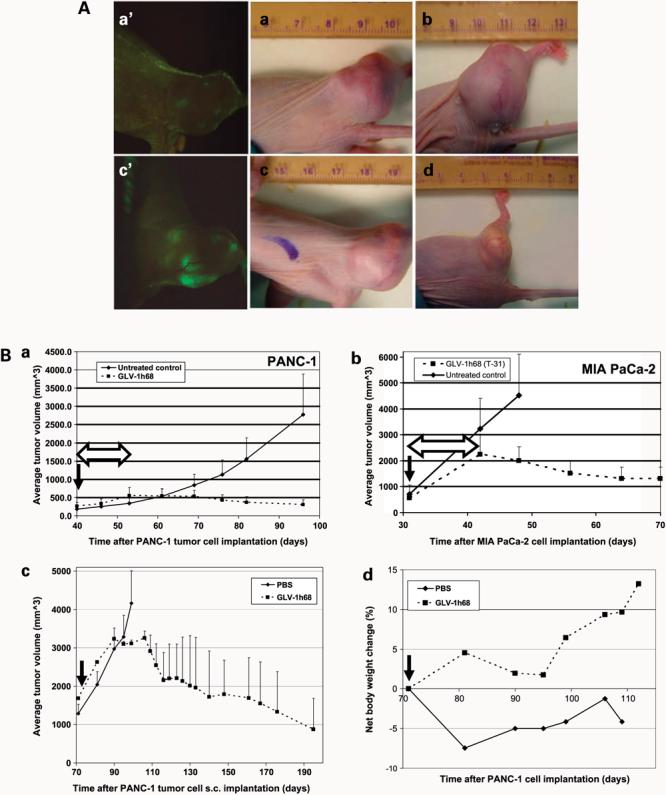
A, real-time imaging of GLV-1h68 viral therapy of s.c. PANC-1 tumors in nude mice. When the tumors reached ∼250 mm3 in size, a single dose (1 × 10⁶ pfu) of the virus was delivered systemically through the i.v. route. No treatment was given in the control group. Tumor sizes of the same mouse as an example at different time points after virus treatment: (a) 2 wk, (b) 3 wk, (c) 1 mo, and (d) 9 mo. Virus-mediated GFP expression in tumors at 2 wk (a′) and 1 mo (c′) postinfection. Note the “whitish” appearance of the residue tumor in d. The major unit of rulers is 1 cm (a-d). B, systemic vaccinia viral therapy of s.c. PANC-1 and MIA PaCa-2 tumors in nude mice. All virus-treated animals received a single i.v. dose of 1 × 10⁶ pfu of GLV-1h68. Median tumor volumes (a and b). Comparison of virus therapy results in PANC-1 and MIA PaCa-2 tumor models (n = 8 per group). T-31, 31 d after tumor cell s.c. implantation into mice. c, virotherapy in nude mice with large PANC-1 tumors (n = 8 per group). d, net animal weight change (%) during the therapy (c). Solid arrows, time points of virus injection; double-headed open arrows, time of tumor regression after virus injection.