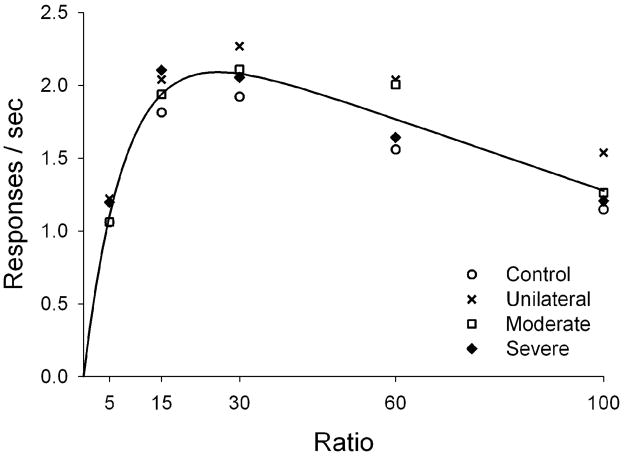
Figure 2.
Mean response rates under the multiple FR schedule during the last 10 sessions of baseline. The curve is drawn by Equation 1 using a single set of parameters, as dictated by the parsimony intrinsic to AICc. Lesion groups are represented by different symbols.

