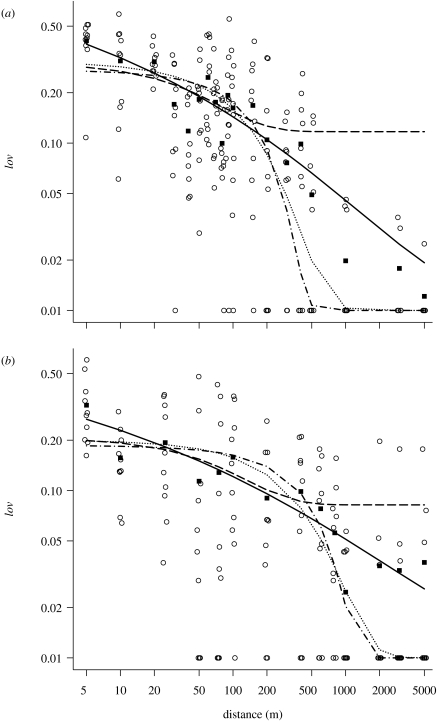
Figure 1.
The proportion of seeds left on the shoe, lov, per distance walked, d. Ten replicates (circles) were performed at each distance by one single walker each for (a) B. nigra and (b) B. oleracea. Means (squares) and model fits (lines, compare table 1) are shown. A small amount of random variation j (log j=0.3) was applied to the x-axis values of the data (‘jitter’) in order to visually separate replicates with identical results. Also, 0.01 was added to each value of lov, including averages and model plots in order to visualize lov=0 on this log–log plot. Dotted line, ae(−bd) (equation 2.5); solid line, ae(−db) (equation 2.4); dashed line, ae(e−bd) (equation 2.3a); dot-dashed line, ae(−ebd) (equation 2.3b).

