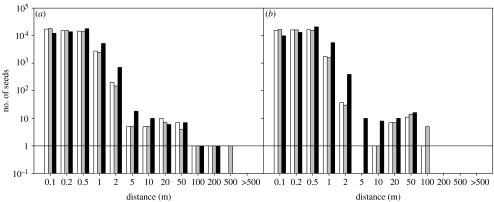
Figure 2.
Predicted dispersal kernels from the mechanistic wind dispersal model using local data and vertical wind velocities of zero average (table 2, scenario 1, white bars), measured average (scenario 2, grey bars) and measured hourly extreme (scenario 3, black bars) conditions for (a) B. nigra and (b) B. oleracea. For each of the three scenarios, 50 000 seeds were simulated for both species. x-axis values represent upper limits of binned results. A solid line indicates y=1.

