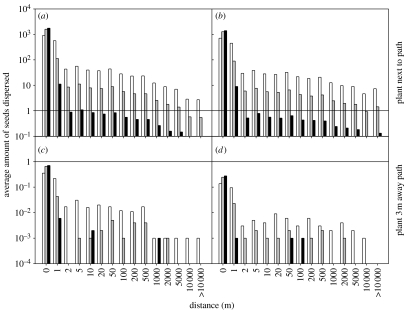
Figure 3.
Combined dispersal kernel for wind dispersal and subsequent shoe dispersal. Average vertical winds (table 2, scenario 2) and the fitted power–exponential model (table 1, equation 2.4) were used. (a–d) correspond to four scenarios: (a,b) plant growing next to the path or (c,d) 3 m away for (a,c) B. nigra and (b,d) B. oleracea. Hence, the average amount of seeds on the path that were potentially available to shoe dispersal varied between subfigure settings (a, 1778; b, 1413; c, 0.72; d, 0.28). The probability of a seed on the path to be picked up by the walker's shoes was also varied (white bars, 0.5; grey bars, 0.1; black bars, 0.01). Results were averaged over 1000 replicated simulations. x-axis values represent upper limits of binned results. A solid line indicates y=1.

