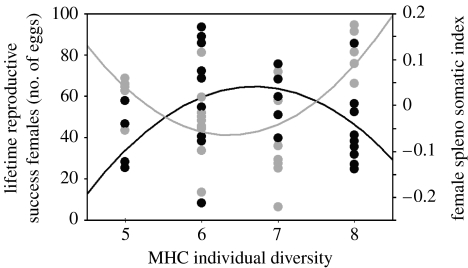
Figure 3.
Graph combining the female LRS (shown as representative number of eggs) and SSI as a function of MHC II B diversity. Females with an intermediate MHC II B diversity having the highest reproductive success are shown by black circles (neggs=38.38+4.514nMHCIIB−11.98(nMHCIIB−6.481)2, F2,26=4.63, p=0.02). Females with an intermediate MHC II B diversity having the lowest SSI, representing a better immunocompetence status, are shown by grey circles (SSI=−0.193+0.02nMHCIIB+0.057(nMHCIIB−6.536)2, F2,26=6.698, p=0.004).

