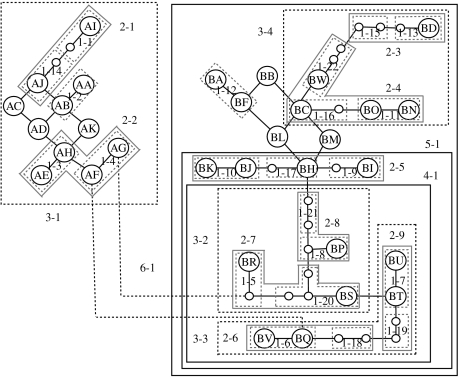
Figure 4.
Hierarchical levels of nesting of the haplotype network generated by statistical parsimony. Each clade is denoted by two numbers, the first denoting the level of nesting and the second indicating the number of the clade at that level of nesting. Each branch between two haplotypes denotes a single mutation. Dashed lines show non-parsimonious connections. Empty circles indicate assumed haplotypes.

