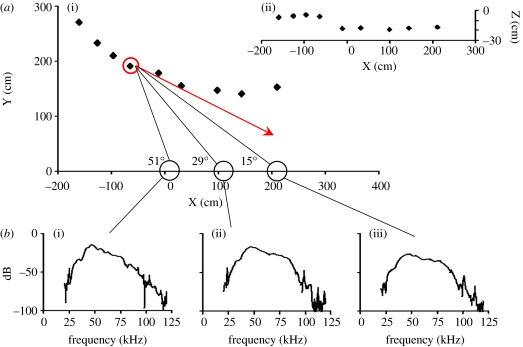
Figure 4.
Flight path, beam direction and spectra. The bat's position at each call was determined from the TOAD and was used to estimate flight paths in (a(i)) the horizontal and (ii) vertical plane. The sonar beam axis was assumed to be parallel to the flight direction (red arrow). From the beam axis, we determined the attack angle (black lines) to each of the microphones in the horizontal array. From left to right, distance and attack angle for the call emitted at the position marked by the red circle were 202 cm, 51°; 252 cm, 29°; 327 cm, 15°. (b(i)–(iii)) The three spectra of this call recorded at the three microphones, illustrating how spectrum depends on distance and direction between bat and microphone.

