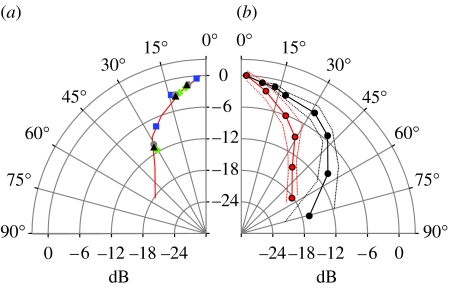
Figure 6.
(a) Individual calls compared to average beam shape. Data points for three angles corresponding to the three microphones are shown from four individual recordings (squares, diamonds, circles and triangles) superimposed on the average beam pattern for 55 kHz (red curve), showing the fine correspondence between single data points and the averaged curve. (b) A comparison of directionality in the laboratory and the field at 55 kHz. In the laboratory, the sonar beam (black curve; standard deviation, dotted lines) was much broader than the beam emitted in the field (red curve; standard deviation, dotted lines). Half-amplitude angles at 55 kHz were 40° and 20° in the laboratory and the field, respectively.

