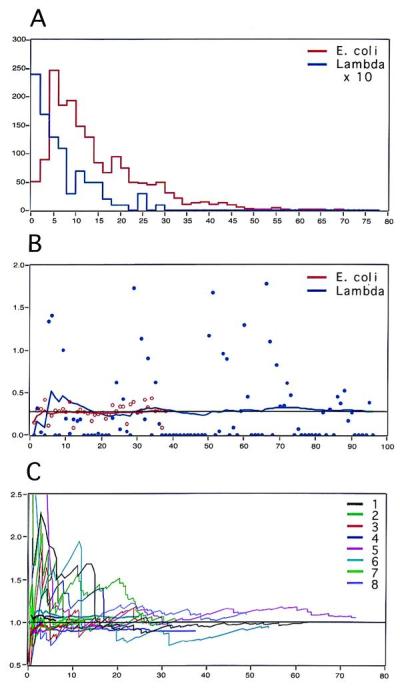
Figure 1.

Lambda dosage in E. coli. (A) Histogram of the sizes of genomic E. coli DNA fragments (red) measured on 38 randomly chosen FOVs and a histogram of the sizes of hybridized lambda probes from the same slide measured on 96 random FOVs (blue, vertical scale has been expanded 10 times). Horizontal axis: size of fragments in μm; vertical axis: number of fragments. The size distribution is typical of sheared DNA. (B) Number of genomes per FOV. Horizontal axis: number of FOVs; vertical axis: number of genomes. Before hybridization, the number of E. coli genomes per FOV was obtained from the total length of combed DNA per FOV divided by 2,320 μm (red circles). After hybridization, the number of lambda genomes was obtained from the total length of the hybridized signals divided by 24.3 μm (blue circles). These numbers fluctuate widely, but the average numbers calculated over the scanned FOVs (red and blue curves) converge rapidly to a common value of 0.3 genome per FOV. (C) Summary of measurements performed on eight different slides. The same experiments as in B were performed for eight different slides. For each slide, we represent the average number of genomes per FOV as a function of the effective number of measured genomes. Thick curves correspond to measurements before hybridization (measurements of counterstained E. coli genomic DNA), thin curves correspond to measurements after hybridization (measurements of the hybridized lambda probe signals). All sets of curves (before/after hybridization) are normalized to 1 to facilitate comparison of the convergence, which occurs between 10 and 20 genomes.
