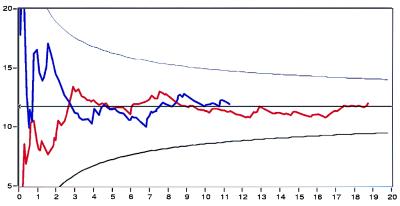
Figure 5.
met oncogene amplification measurements. DNA from the GTL-16 cell lines was combed on several slides. BAC RG253B13 encompassing the met region (FITC detection) and cosmids F08132, H0973, H03115, F08121, and F02103 from chromosome 21 (Texas red detection) were simultaneously hybridized. The blue and purple curves correspond to two different experiments. The curve represents the evolution of the measured ratio (the effective number of measured BAC probes divided by the effective number of chromosome 21) as a function of the effective number of detected control chromosomes (chromosome 21). A convergence to a final ratio of 11.5 is observed after a transient regime extending over fewer than 10 haploid genomes. Experimental curves are confined within the two 95% confidence level envelopes (thin curves) calculated by using Eq. 4 (see Materials and Methods), for p = 1, q = 5, and r = 11.5.

