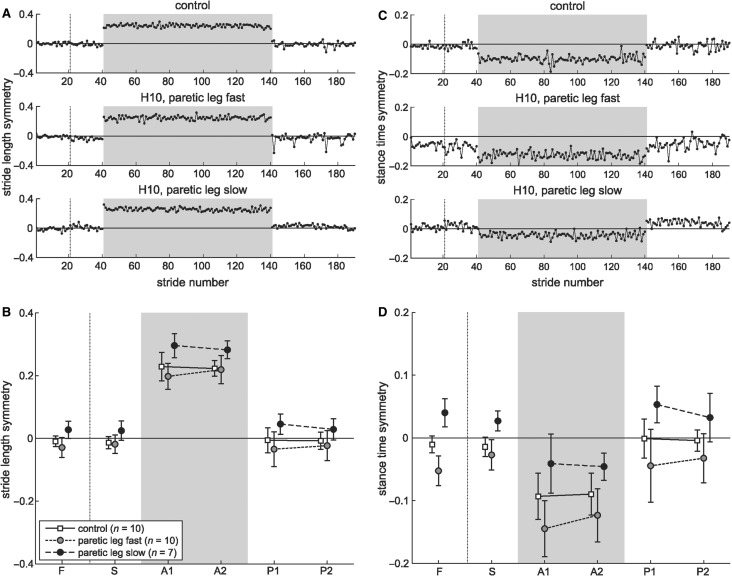
Figure 2.
Feedback control: ability to make immediate reactive responses. Stride-by-stride values for stride length symmetry (A) and stance time symmetry (C) from a typical control (top row) and hemispherectomy subject (bottom two rows) for the first 20 strides of fast and slow baselines, first 100 strides of split-belt adaptation, and first 60 strides of post-adaptation. Zero indicates symmetric stride length or stance time, negative value indicates that stride length or stance time on the fast leg is shorter relative to slow leg. Dotted vertical line indicates stop between fast and slow baseline. Shaded area indicates split-belts condition. Group averages for stride length (B) and stance time symmetry (D) during baseline conditions (slow, S and fast, F), split-belt adaptation (early, A1 and late, A2) and post-adaptation (early, P1 and late P2) for control (white squares) and hemispherectomy group with paretic leg fast (grey circles) or paretic leg slow (black circles). Each data point represents mean ± 1 SD over five strides. Note that symmetry index was always calculated with the slow leg as reference. Since we tested hemispherectomy subjects with their paretic leg fast in one experiment and slow in another, the symmetry index reversed sign at baseline due to this convention (grey versus black circles).

