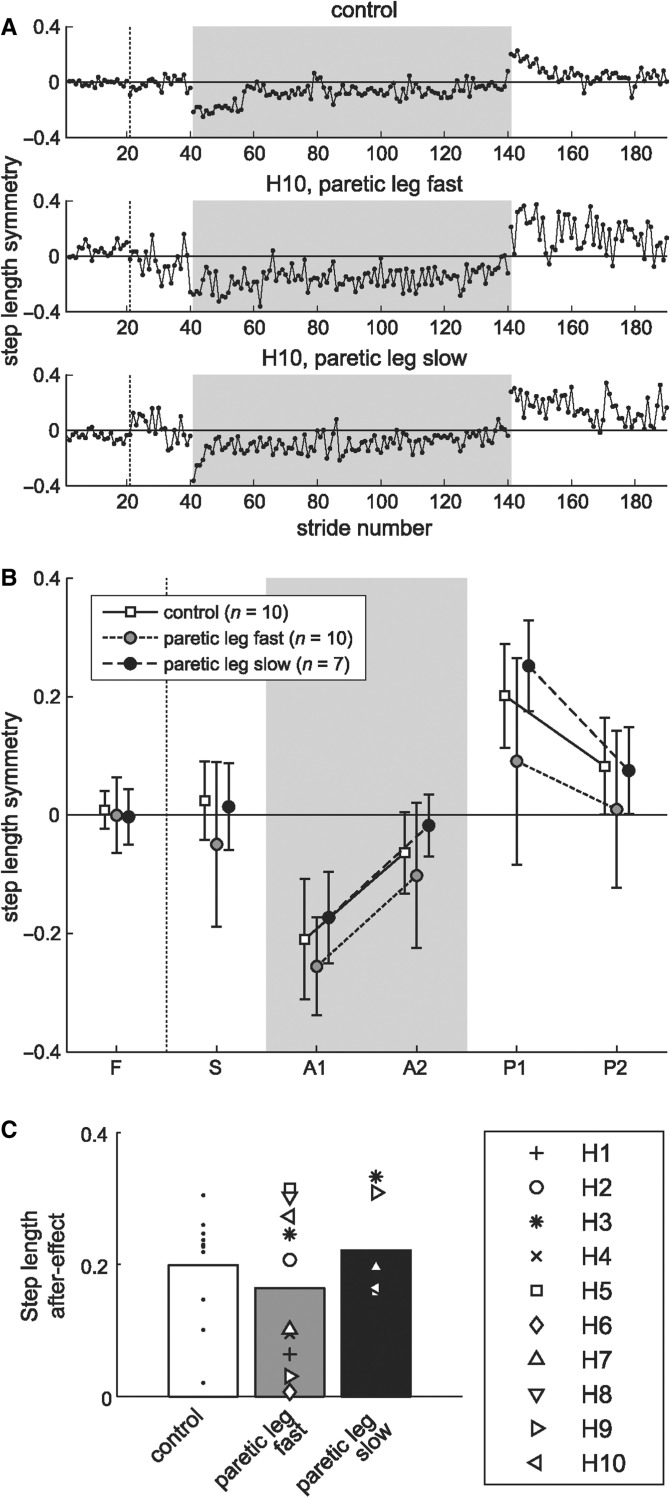
Figure 3.
Feedforward adaptation: measured by the presence of after-effects. (A) Stride-by-stride values for step length from a typical control (top row) and hemispherectomy subject (bottom two rows) for the first 20 strides of fast and slow baseline, first 100 strides of split-belt adaptation, and first 60 strides of post-adaptation. Zero indicates symmetric step length; negative value indicates that step length on fast leg is shorter relative to slow leg. Shaded area indicates split-belts condition. (B) Group averages for step length during baseline conditions (slow, S and fast, F), split-belt adaptation (early, A1 and late, A2) and post-adaptation (early, P1 and late P2) for control (white squares) and hemispherectomy group with paretic leg fast (grey circles) or paretic leg slow (black circles). Each data point represents mean ± 1 SD over five strides. (C) Post-adaptation after-effects relative to baseline (P1 minus S). Bars represent mean after-effect in control (white) and hemispherectomy subjects with paretic leg fast (grey) or paretic leg slow (black), with individual data overlaid. The presence of an after-effects indicated involvement of a feedforward adaptation.

