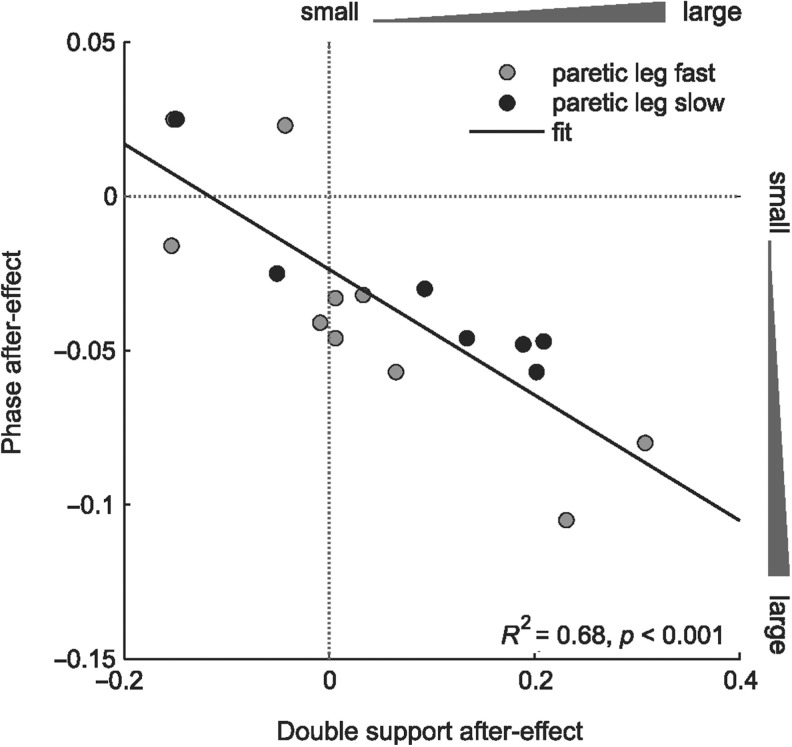
Figure 5.
Relationship between adaptation of double support and interlimb phase. Each data point represents the after-effect in double support (x-axis) and phase (y-axis) for individual hemispherectomy subjects trained with paretic leg fast (grey circles) or paretic leg slow (black circles). There is a clear correlation (linear fit) between the two temporal parameters, where smaller after-effect in double support corresponded with smaller after-effect in phase. Notice offset in this relationship (i.e. line shifted left of origin). Some hemispherectomy subjects had small after-effect in double support, yet showed after-effect in phase.

