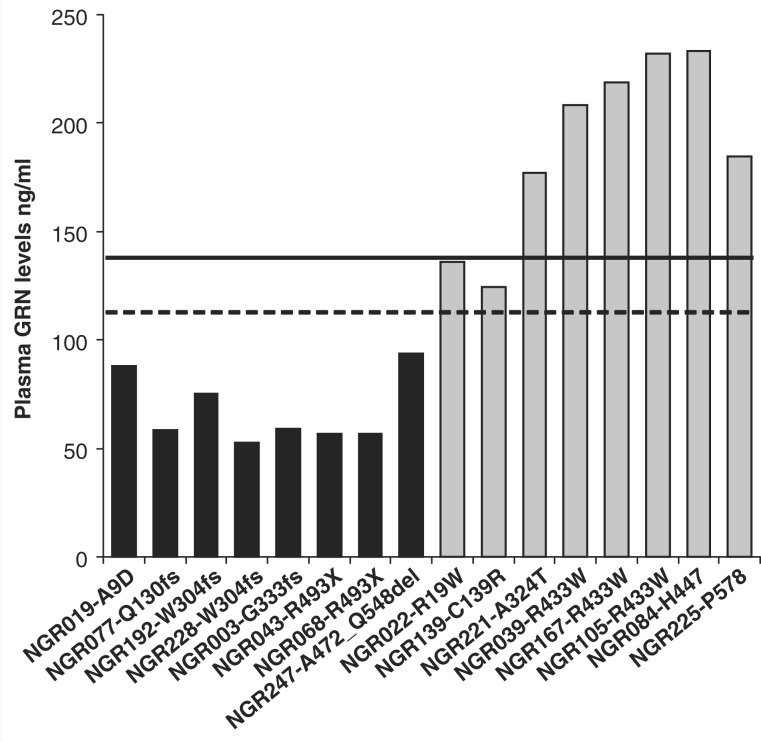
Figure 2.
Specific plasma GRN levels in all types of GRN mutations. GRN expression is plotted for each patient with FTLD from our cohort carrying a GRN mutation. Black bars represent patients with FTLD carrying pathogenic GRN loss-of-function mutations; grey bars represent patients with FTLD carrying GRN mutations with unknown significance. The dashed line is the cut-off value for pathogenic GRN loss-of-function mutations based on the complete FTLD series and the black line indicates the minimum GRN expression identified in our control cohort (Fig. 1). Missense mutations p.R19W and p.C139R show GRN levels below the range detected in control individuals and may induce a partial loss of GRN function.

