Fig. 2.
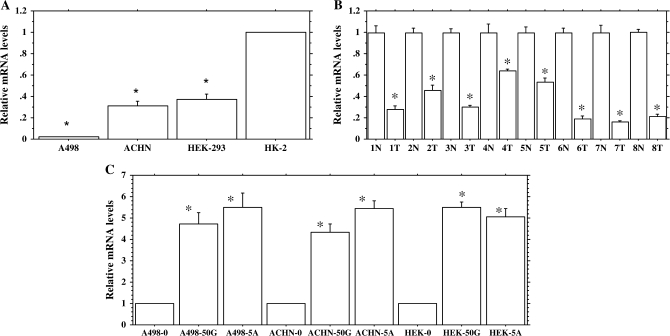
BTG3 expression profile. (A) Expression profile of BTG3 in renal cancer (RCC) and non-malignant-immortalized kidney cells. (B) Expression profile of BTG3 in renal carcinoma (T) and normal (N) clinical samples. (C) Relative expression profile of BTG3 gene following treatment with 0 and 50 μM genistein (50G) and 5 μM 5-Aza-2′-deoxycytidine (5A). Relative quantification was performed by quantitative real-time PCR using the following formula: Fold change in gene expression, 2−ΔΔCt = 2−[▵Ct (genistein-/5Aza-C-treated samples) − ΔCt (untreated control)], where ΔCt = Ct (detected genes) − Ct (GAPDH) and Ct represents threshold cycle number. For untreated controls data were normalized to 1. Data are in triplicate from three independent experiments. All data are expressed as the mean ± SE (bars). *Statistically significant at P < 0.05.

