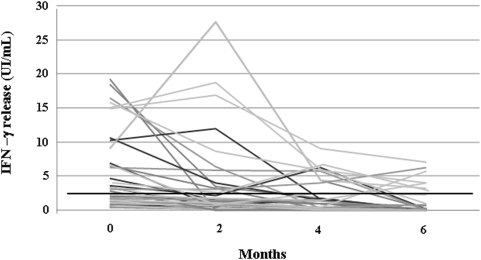
Figure 1. Longitudinal changes of specific IFN-γ response in 38 TB patients following anti-tuberculous treatment.
IFN-γ response to sum of ESAT-6 and CFP-10 (overlapping peptides) was measured by QFT-G before, during and at the end of treatment. A significant decrease of IFN-γ response to mycobacterial antigens was found during the therapy (p<0.001, Wilcoxon's signed-rank test). [p: for the comparison of the results at baseline vs. completion of therapy]. Horizontal black line indicates the QFT-G assay cut-off value for a positive result (0.35 UI/mL).

