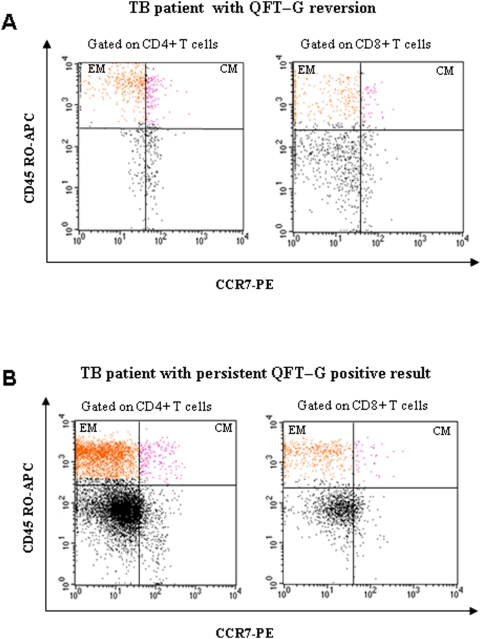
Figure 3. Cytofluorimetric analysis of phenotypic profile of T cells from two representative TB patients at the end of treatment.
A representative sample of one TB patient with QFT-G reversion (positive to negative) at the end of therapy (panel A) and one TB patient with persistent QFT-G positive result (panel B) is shown. The percentage of CD4+ and CD8+ T cells that expressed CD45RO and lymphotropic chemokine receptor CCR7 was assessed in diluted whole blood after 6 days of in vitro stimulation with intact recombinant ESAT-6 and CFP-10 proteins. Effector memory (EM) cells (CD45RO+/CCR7−) are shown in the upper left quadrants of both panels; central/memory (CM) cells (CD45RO+/CCR7+) are showed in the upper right quadrants of both panels.

