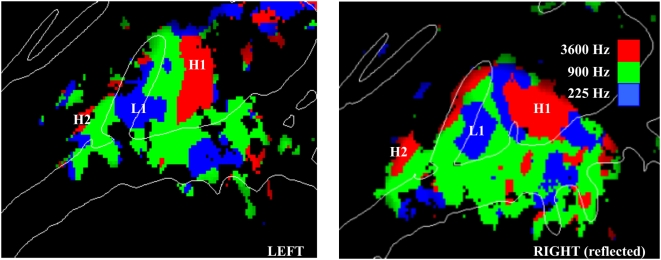
Figure 5. Mirror-image tonotopic organization of auditory cortex shown for the left and right (reflected) hemispheres.
Plots show regions with significant activations coded by the frequency that produced maximal activation at that point. Red = 3600 Hz, Green = 900 Hz, Blue = 225 Hz. Averaged over subjects, continuous and sparse sampling, sound spatial position, and sound intensity. Activation maps are shown on the average gyral structure (white lines) of the left and right hemispheres. z-score threshold = 4.0. H1 and H2 identify posterior and anterior foci driven by high-frequency tones whereas L1 shows a central region driven by low-frequency tones.

