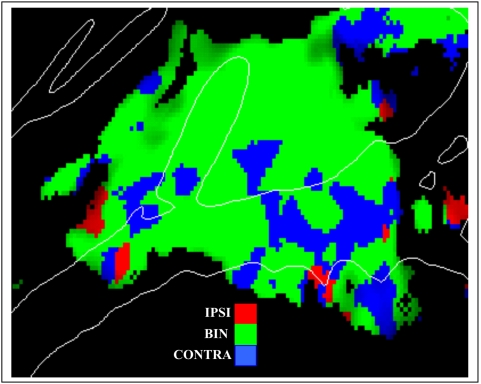
Figure 9. Effects of Ear of Delivery.
Significant activations with the color showing the tone location producing maximal activation at that point on the cortical surface. Red = ipsilateral ear, green = binaural, blue = contralateral ear. Averaged over subjects, attention, image acquisition, frequencies and hemispheres. z-score threshold = 4.0.

