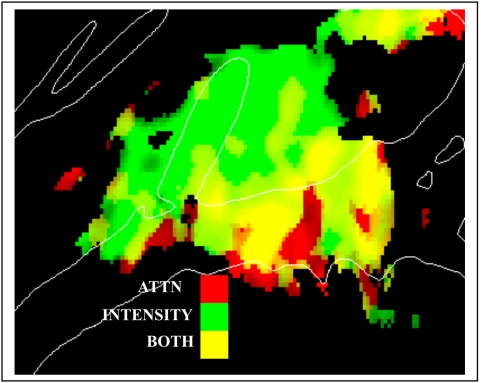
Figure 12. Effects of intensity vs. attention.
Significant activations over a z-score range of 5.0 to 10.0 with the degree of saturation showing the z-score, and the color showing relative magnitude of activation for attention effects (Red) and Loud-Soft differences in activation magnitude (Green). Yellow = both attention and intensity. Data averaged over subjects, locations, image acquisition, frequencies and hemispheres.

