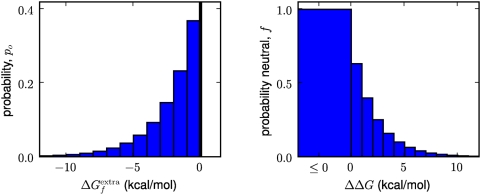
Figure 2. Stability distributions and fixation probabilities.
The panel at left show the probability  that a protein in an evolving population will have
extra stability
  , as given by Equation 3. The panel at right shows the
probability
  that a mutation that causes a stability change of
  will be neutral, as given by Equation 4. The units for
  are arbitrary; for concreteness here we give them
units of kcal/mol.

