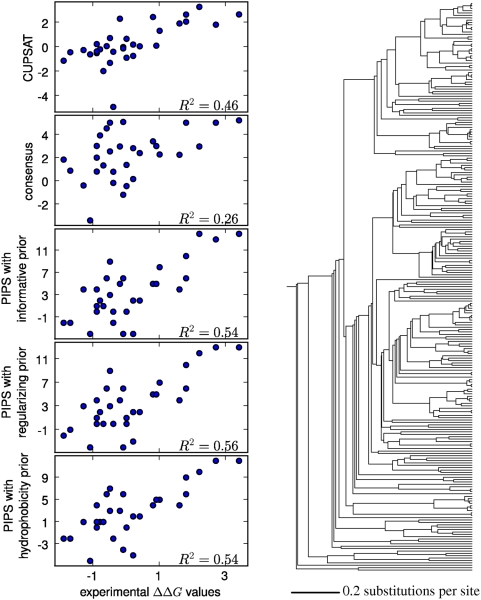
Figure 6. Experimentally measured and predicted  values for the 156-residue ribonuclease HI protein.
The plots at left show the predictions made by the CUPSAT physicochemical
modeling program, the consensus approach, and the PIPS phylogenetic
inference program using the informative, regularizing, and
hydrophobicity priors. To the right is the phylogenetic tree of 239
sequences that was utilized by the PIPS program. The  values are the squared Pearson correlation
coefficients.

