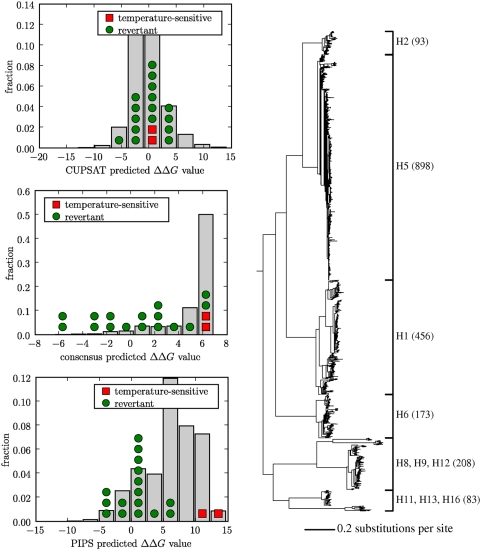
Figure 9. Predicted stability effects of known temperature-sensitive and revertant mutations to H1 hemagglutinin.
In the plots at left, bars indicate the distribution of predicted  values for all single mutations, while symbols show
predicted values for the temperature-sensitive and revertant mutations.
At right is the phylogenetic tree utilized by the PIPS program. The tree
labels give the hemagglutinin subtypes and corresponding numbers of
sequences. The PIPS predictions are made using the informative
priors.

