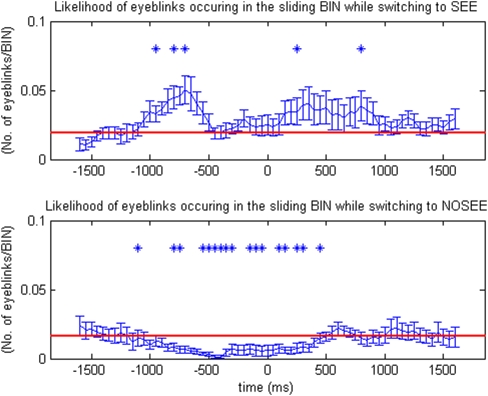
Figure 2. Rates of eyeblinks (n = 10) around the time of a perceptual switch (time 0).
The rate of eyeblinks rises before and after perceptual transitions from ‘no see’ to ‘see’, and decreases during perceptual transitions from ‘see’ to ‘no see.’ In the two-tailed simple t-test, those data points that are significantly different than the baseline (red line) are marked as * (p<0.05)

