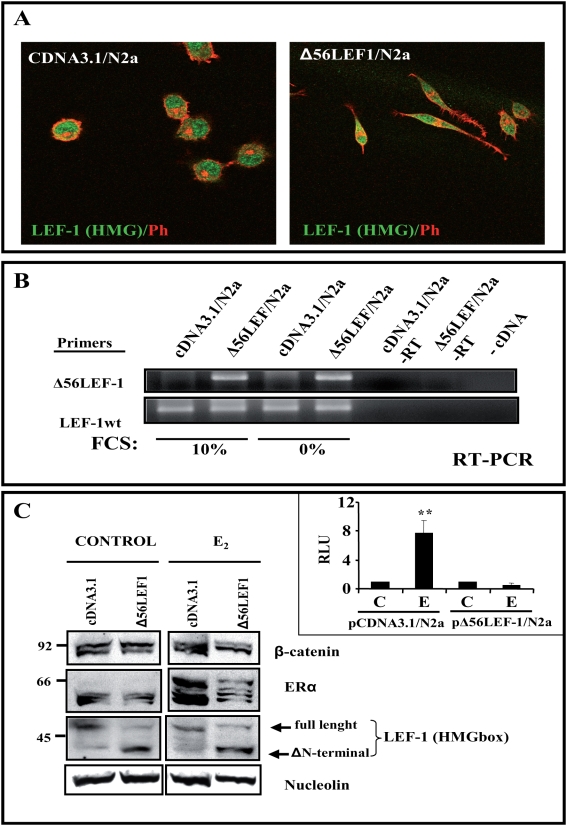
Figure 8. Generation of a stable N2a-m cell line expressing the Δ56LEF-1 protein.
N2a-m cells were co-transfected with Δ56LEF-1 or the empty pCDNA3 vector containing the Puromycin resistance gene (for details see Methods ). (A)- N2a-m-Δ56LEF-1 expression was observed by dual immunocytochemistry using an LEF-HMGbox antibody (green) and Phalloidin (red). Note the morphological changes associated with the expression of LEF-1 mutant. (B)- RNA from the different stable N2a-m cell lines was obtained and the RT-PCR products were analyzed in agarose gels. Expression of the Δ56LEF-1 plasmid was tested using oligos specific to the Δ56LEF-1 plasmid, in parallel with specific oligos recognizing endogenous LEF-1 protein (LEF-1-wt) as controls. Note that no significant differences in plasmid expression were observed between cells growing in 10% FCS compared to those grown in the absence of FCS. (C)-Protein expression was determined to test for the presence of the mutant LEF-1 protein in N2a-m cells. Nuclear extracts were prepared from control and estradiol treated cells, and little accumulation of β-catenin was detected after exposure to estradiol although the estrogen receptor does enter the nucleus. The LEF-HMG box antibody allows us to differentiate full-length LEF-1 from Δ56 LEF-1 in western blots. Nucleolin levels were used as an internal control. The right insert represents the luciferase activity (RLU) of both stable cell lines. A functional analysis was performed to check the loss of estradiol induction over TOPFlash in these cells, as previously reported for the transient transfection (Figure 6C). The graph shows the normalized luciferase activity from at least three independent experiments. The P value from the Student's t-test was ** (P≤0.01) when compared with control data.

