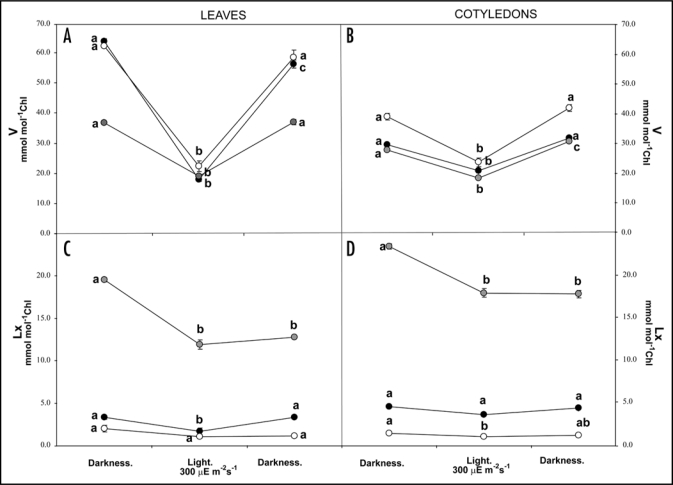
Figure 1.
Induction of V and Lx cycles in leaves and cotyledons of C. sativus (grey symbols), C. maxima (black symbols) and Cucurbita pepo (white symbols) in dark adapted samples, after illumination of 30 minutes at 300 µE m−2s−1 and following by a dark recovery for 16 hours. Each value represents the mean of 3 replicates ± S.E. Analyses of Variance (ANOVAs) was performed, considering type of treatment (darkness, light treatment and darkeness) as fixed factors in each species. Different letters denote statistically significant differences at p < 0.05 among treatments in each species after Student-Newman-Keul test.

