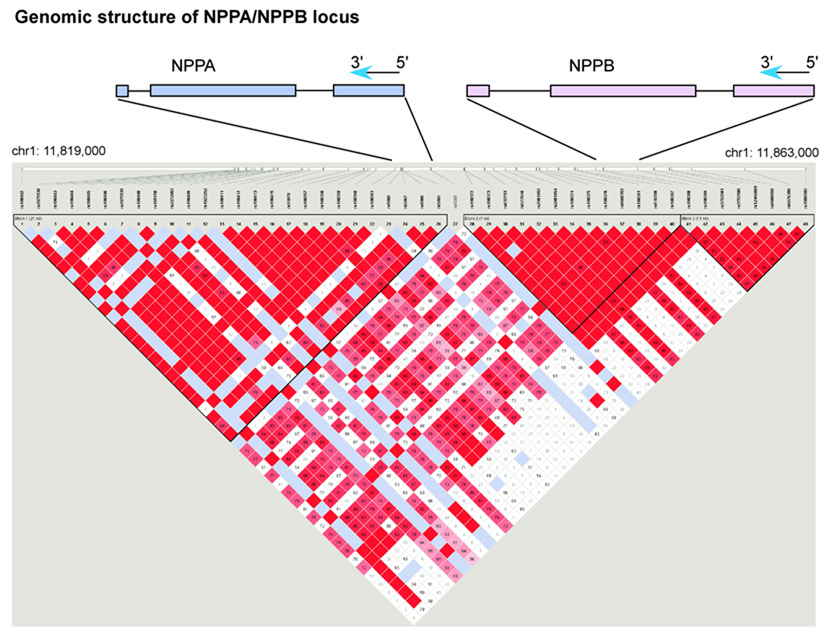
Figure 1. Linkage disequilibrium map across NPPA, NPPB locus in CEPH reference sample.
The exon structures of NPPA and NPPB are shown schematically relative to the SNPs genotyped in the reference samples. The two genes fall on the negative strand of the human genome reference sequence and thus are in 3’ to 5’ order as shown. All SNP alleles in the text are shown according to the coding (negative) strand sequence. The pairwise linkage disequilibrium (LD) relationships among the 48 polymorphic (minor allele frequency ≥5%) SNPs passing quality control in the CEPH reference sample are shown. The linkage disequilibrium between all pairs of SNPs tested is represented at the bottom of the figure: red square indicates significant LD, white indicates weak LD, and light blue reflects inadequate power to determine LD. Three blocks of strong linkage disequilibrium are shown. The NPPA gene falls within the first block and a small region of LD breakdown between the first and second blocks. The NPPB gene lies within the second block of strong LD. Figure prepared using HaploView v2.03, defining blocks using the ‘spine of LD’ method. 35 The genomic position on chromosome 1 is indicated with reference to the hg17 assembly of the human reference sequence (May 2004, NCBI build 35). The SNP numbering 1–48 corresponds to the SNPs as ordered in Supplementary Table 1.

