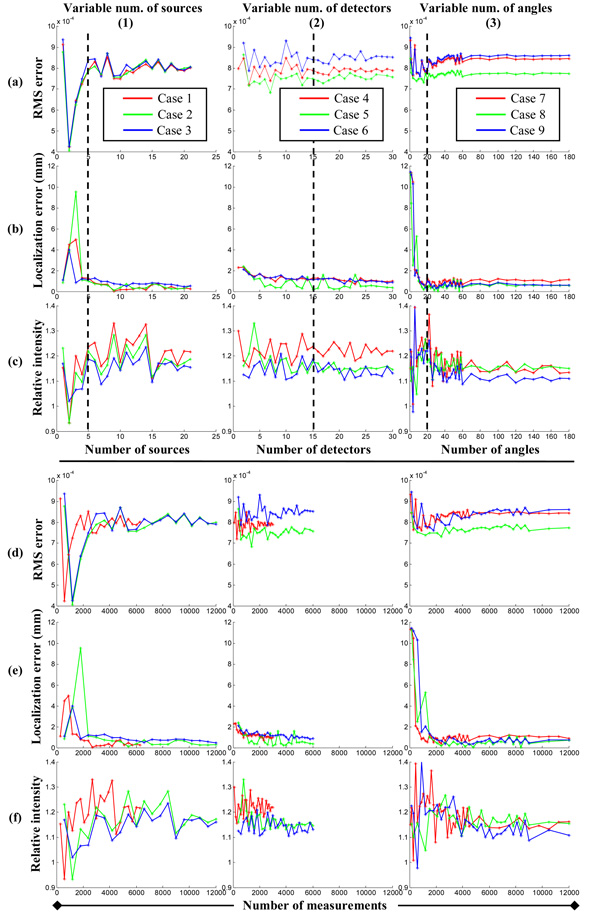
Fig. 3.
Image quality metrics derived from experimental data in terms of (a) RMS error, (b) localization error, and (c) relative intensity in different study cases, from left to right: variable number of sources (Cases 1 to 3), detectors (Cases 4 to 6), and imaging angles (Cases 7 to 9). The bottom rows (d–f) are derived from the same data as in (a–c) but are plotted against the number of measurements.

