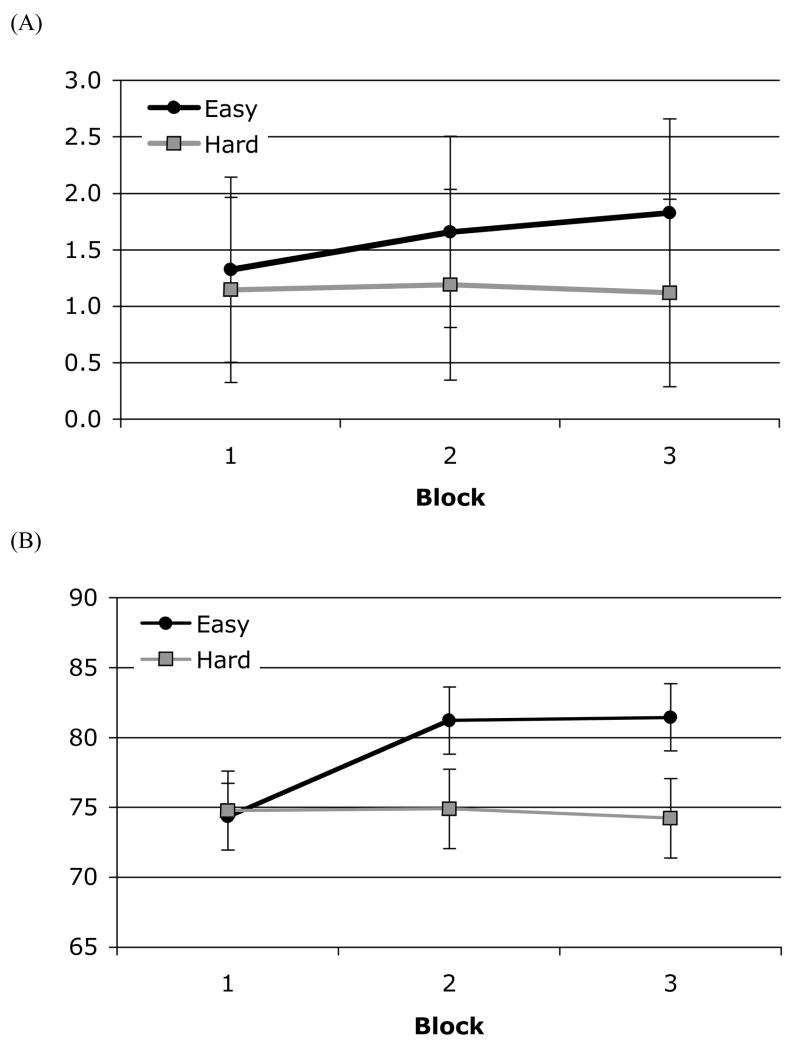
Figure 5.
Performance in Session 8 as a function of Block by Condition in Experiment 2. (A) The discrimination index (d′); error bars represents the 95% confidence intervals (CIs) in the by-participant analysis. (B) Percent correct; error bars represents the 95% confidence intervals (CIs) in the by-trial analysis.

