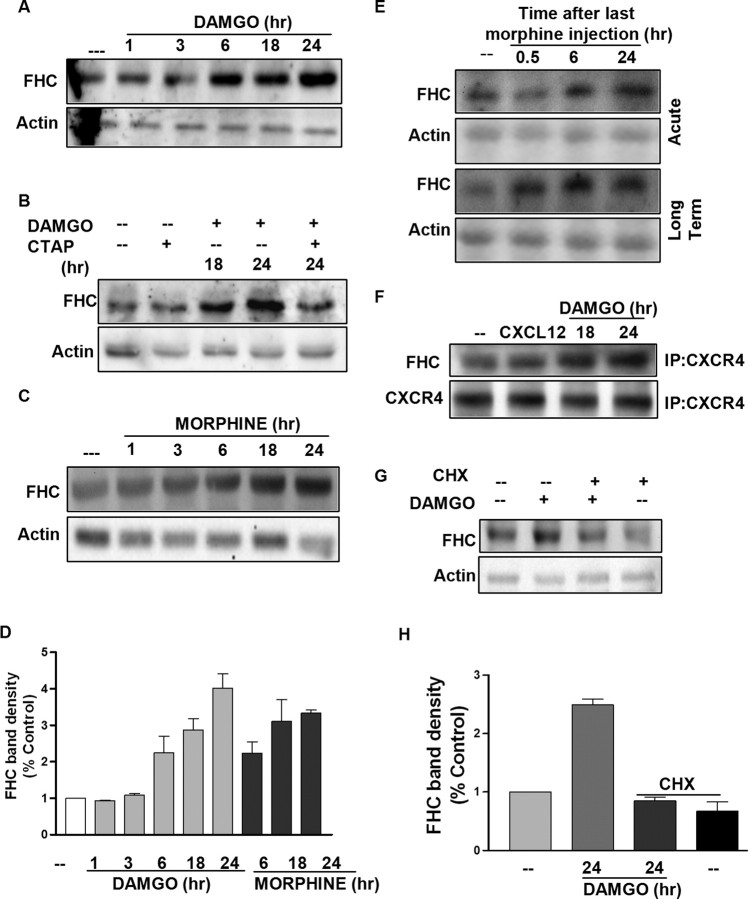
Figure 6.
Opioids upregulate FHC protein levels in cortical neurons and brain homogenates. Cortical neurons were treated with 1 μm DAMGO (A, B) or morphine (C) for indicated time periods. Whole-cell extracts were run on a 10% SDS-PAGE, followed by immunoblotting using a FHC-specific antibody (see also supplemental Fig. 3B, available at www.jneurosci.org as supplemental material). B, The involvement of μOR was confirmed by using CTAP (1 μm). D, The bar graph shows FHC band density (mean ± SEM) represented with respect to control; DAMGO or morphine treated (6 to 24 h) are all significantly higher than control (p < 0.05). E, Cortical tissue homogenates were prepared from control or morphine-treated rats as described in Materials and Methods. F, Coimmunoprecipitation (IP) studies on neurons incubated with either 20 nm CXCL12 (15 min) or 1 μm DAMGO (18 or 24 h). After blotting for FHC, membrane was stripped and reprobed for CXCR4. G, Neurons were treated with DAMGO and/or CHX for 24 h, and whole-cell extracts were immunoblotted for FHC. Membranes were stripped and reprobed for actin to confirm equal loading. H, The bar graph represents FHC band densities (mean ± SEM) represented with respect to control levels (DAMGO plus CHX group is significantly lower than DAMGO alone; p < 0.05).

