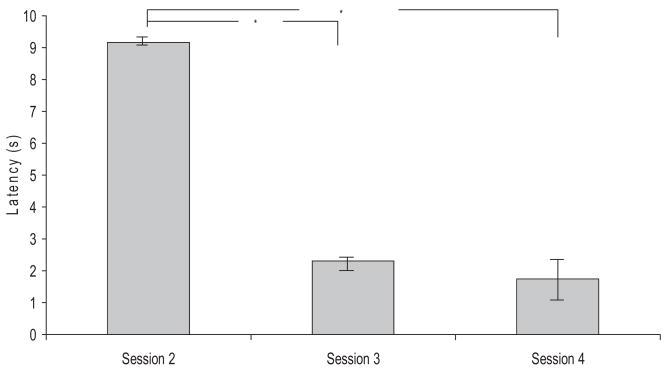
Figure 5.
Latency of the DA oxidation peak from time of CS onset in Paired animals that showed learning across Sessions 2, 3 and 4. Latency was determined from the time of CS onset. Analysis was limited to peaks ≥16%, which were voltammetrically identified as DA. * p<.05 compared to Session 2. Note the significant decrease in latency after Session 2.

