
Figure 3.
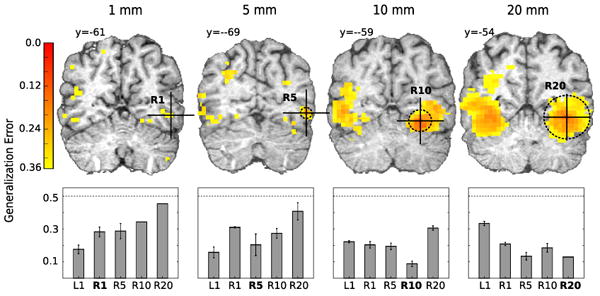
Searchlight analysis results for CATS vs. SCISSORS classification for sphere radii of 1, 5, 10 and 20 mm (corresponding to approximately 1, 15, 80 and 675 voxels per sphere respectively). The upper part shows generalization error maps for each radius. All error maps are thresholded arbitrarily at 0.35 (chance level: 0.5) and are not smoothed to reflect the true functional resolution. The center of the best performing sphere (i.e. lowest generalization error) in right temporal fusiform cortex or right lateral occipital cortex is marked by the cross-hair on each coronal slice. The dashed circle around the center shows the size of the respective sphere (for radius 1 mm the sphere only contains a single voxel). MNI-space coordinates (x, y, z) in mm for the four sphere centers are: 1 mm (R1): (48, -61, -6), 5 mm (R5): (48, -69, -4), 10 mm (R10): (28, -59, -12) and 20 mm (R20): (40, -54, -8). The lower part shows the generalization errors for spheres centered around these four coordinates, plus the location of the univariately best performing voxel (L1: -35, -43, -23; left occipito-temporal fusiform cortex) for all radii. The error bars show the standard error of the mean across cross-validation folds.