
Figure 4.
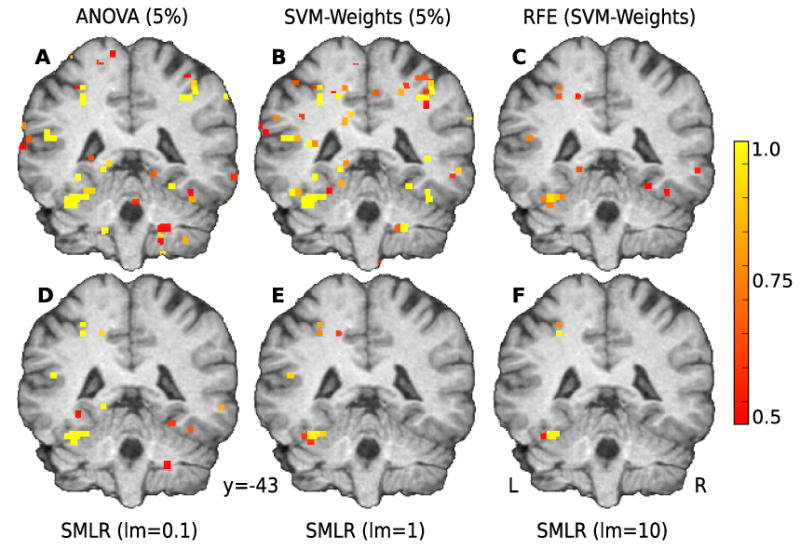
Feature selection stability maps for the CATS vs. SCISSORS classification. The color maps show the fraction of cross-validation folds in which each particular voxel is selected by various feature selection methods used by the classifiers listed in Table 1: 5% highest ANOVA F-scores (A), 5% highest weights from trained SVM (B), RFE using SVM weights as selection criterion (C), internal feature selection performed by the SMLR classifier with penalty term 0.1 (D), 1 (E) and 10 (F). All methods reliably identify a cluster of voxels in the left fusiform cortex, centered around MNI: -34, -43, -20 mm. All stability maps are thresholded arbitrarily at 0.5 (6 out of 12 cross-validation folds).