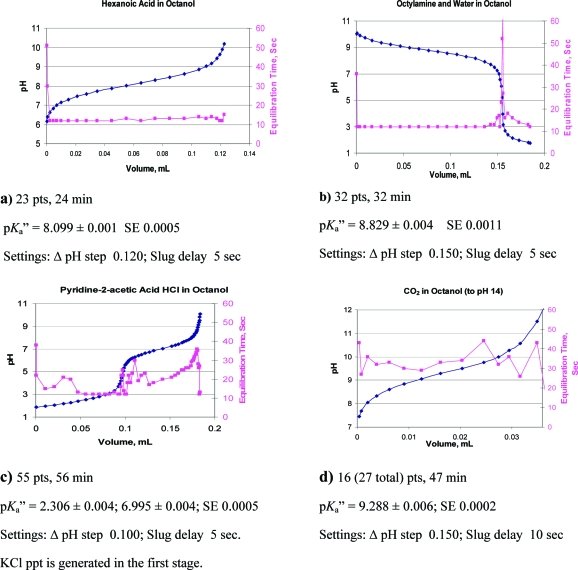
Figure 3.
Representative titration curves overlaid with plots of equilibration times. The pKa′′ ± SE is shown for each titration. Equilibration times are indicative of the quality of a titration. Plots a and b represent near ideal parameter selections. Plot c has more points than needed. Equilibration times may be influenced by the production of insoluble KCl (c) or the concentration or nature of the ion pair produced (d).

