Figure 9.

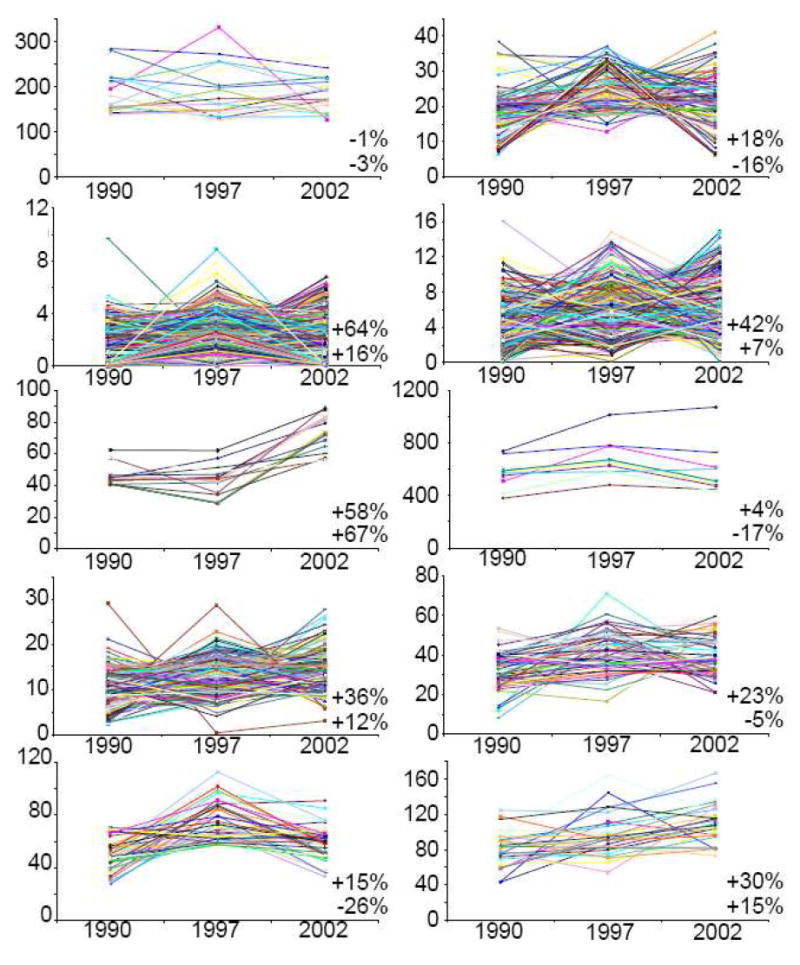
The k-means clustering of all leiomyoma proteins over the archival years from 1990 to 2002 on the x-axis. Proteins in each of ten clusters are varied in abundance as determined by the number of spectral counts on the y-axis.

The k-means clustering of all leiomyoma proteins over the archival years from 1990 to 2002 on the x-axis. Proteins in each of ten clusters are varied in abundance as determined by the number of spectral counts on the y-axis.