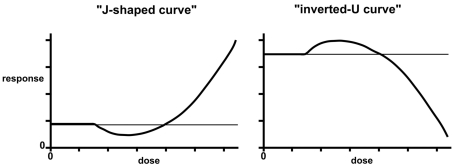
FIGURE 2.
Dose-response curve showing hormesis in the form of a J-shaped curve and an inverted-U curve. In the former the effect on the ordinate is a biological dysfunction, such as carcinogenicity or any other indicator of toxicity. In the latter, the response is a normal biological function such as growth.

