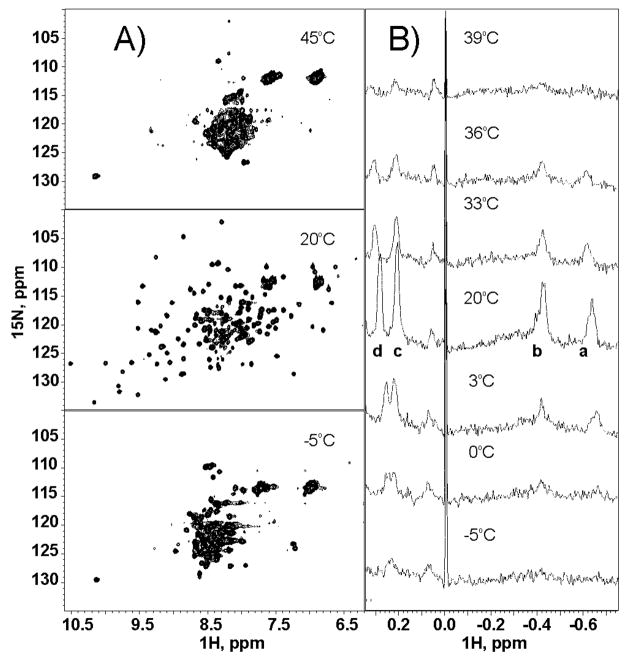
Figure 1.
Representative NMR spectra of Yfh1 in the temperature range −5 to 45 °C: (A) 15N-1H HSQC correlation spectra of Yfh1 in 20 mM HEPES at pH 7.0 at three representative temperatures; (B) high field portions of 1D spectra of Yfh1 in 20 mM HEPES at pH 7.0 at seven representative temperatures. The sample used for quantitative measurements was extensively dialyzed and contains TSP for reference (0 ppm) and calibration.

