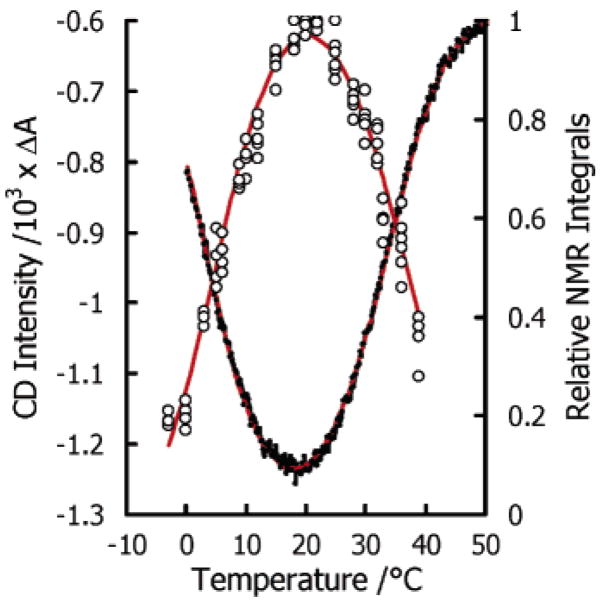
Figure 2.
Plots of NMR and CD signals of Yfh1 as a function of temperature. Relative integrals of the highest field peaks of Yfh1 in HEPES at pH 7.0 are shown as circles (right-hand side scale). Far UV absorbance in the CD spectra of Yfh1 in 20 mM Tris at pH 7.5 corresponds to the left-hand side scale.

